This case study focuses on Bellabeat, a wellness brand for women, and provides analysis on smart device usage to inform and refine their marketing strategy. RStudio, a programming tool built for R, was employed to clean, analyse and visualise the data.

This project examines Airbnb's influence on hotel performance before and during the COVID-19 pandemic in London from 2018 to 2020.

The objective of this project is to analyse real-life data from the New York Stock Exchange and create informative visual tools to communicate the results.

The objective of the project is to query the Chinook Database, which contains information about a music store.

Dive into the heartwarming and captivating stories of the 2000s. This viz is part of the #DataPlusMovies challenge, inspired by magazines from the 2000s.

This storyboard examines flights within the United States during 2015. It specifically focuses on July and August due to their heightened flight activity.
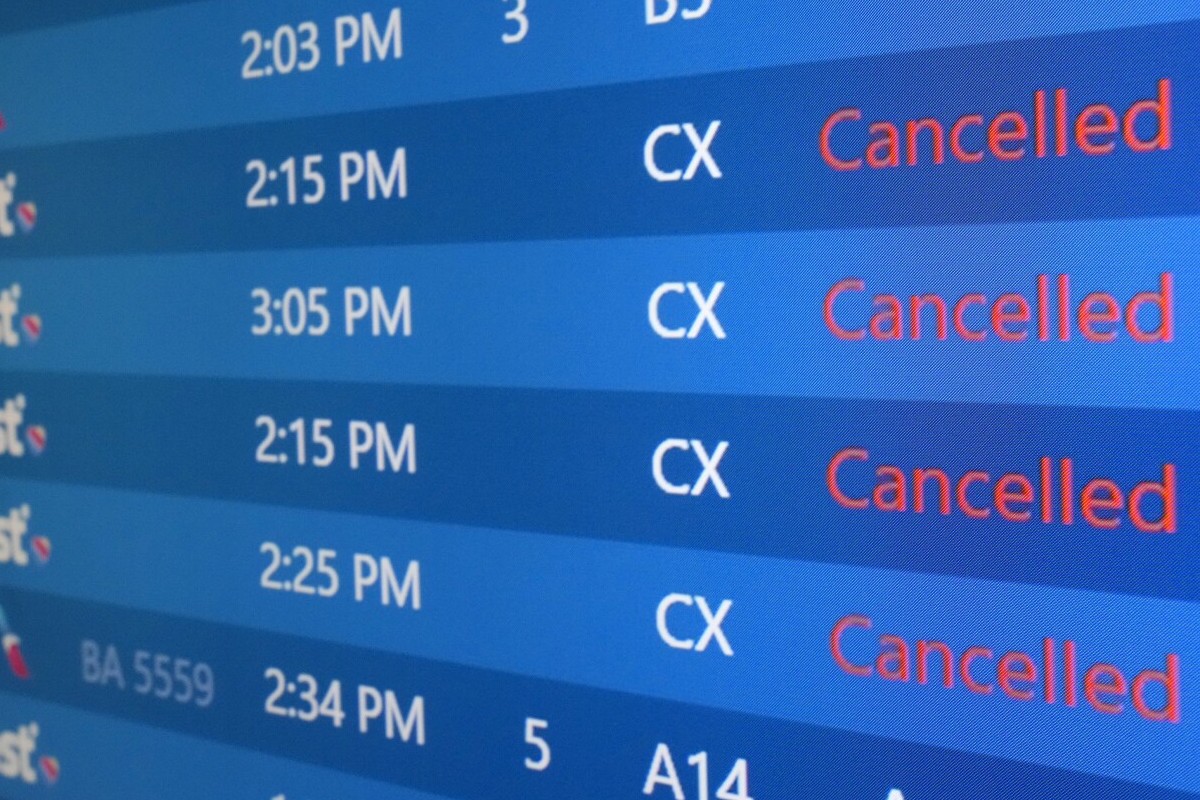
This storyboard examines flight cancellations within the United States during the year 2015, focusing on February due to its highest number of cancellations.
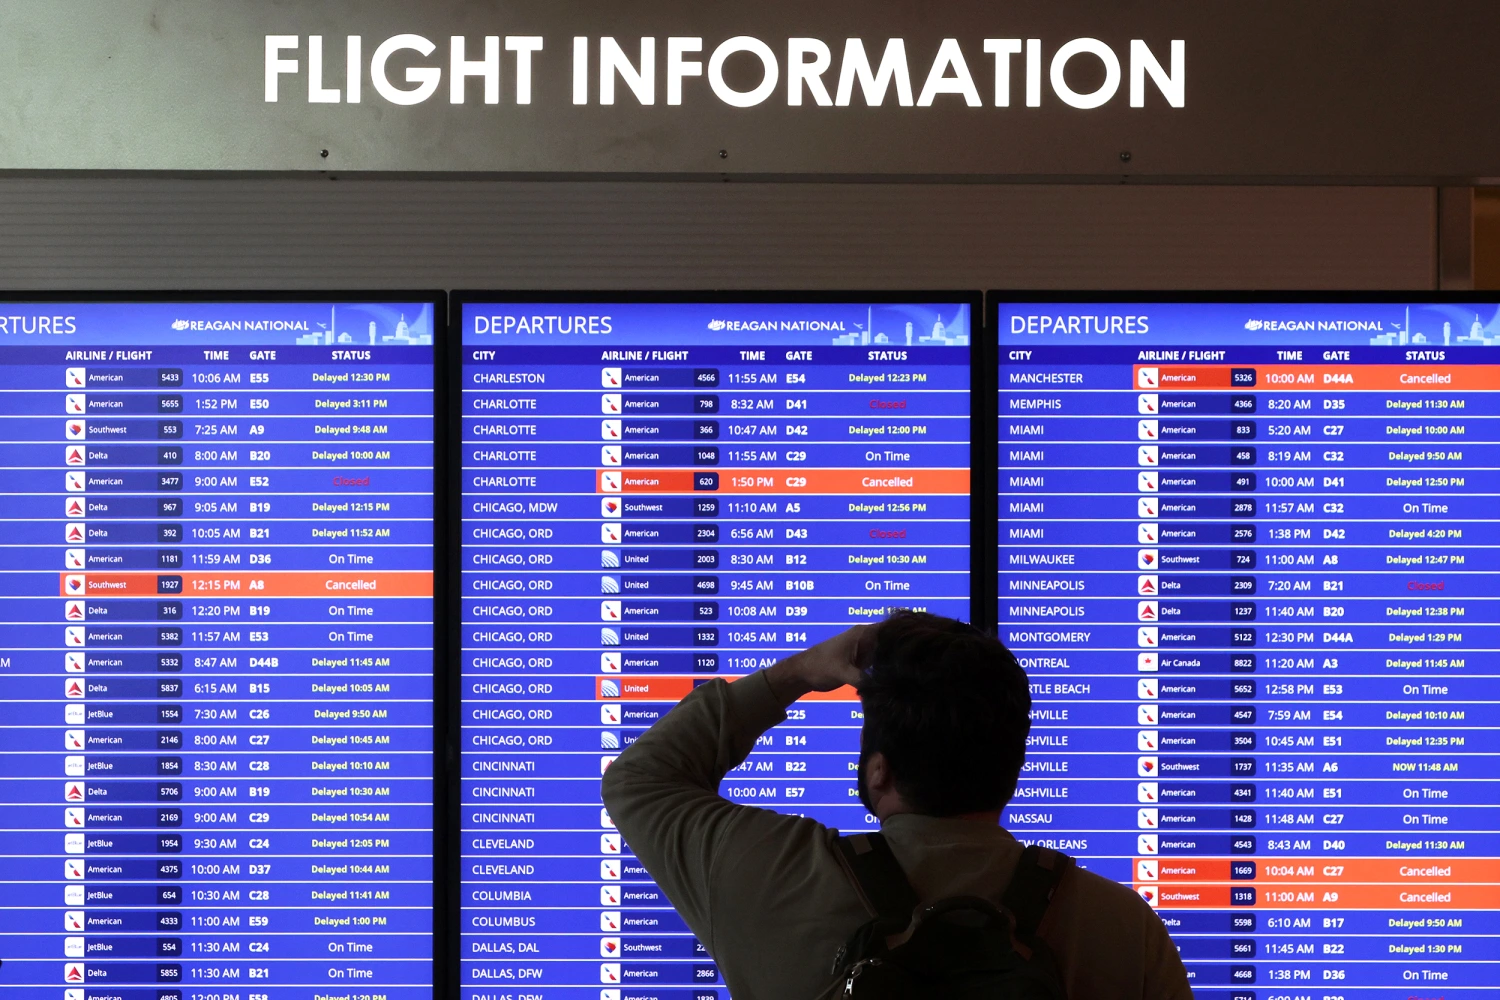
This storyboard examines flight delays within the United States during the year 2015. Specifically focusing on February and June.