New York Stock Exchange (NYSE) Analysis
The objective of this project was to analyse real-life data from the New York Stock Exchange and create informative visual tools to communicate the results.

1. Introduction
This project is part of Udacity’s Business Analytics Nanodegree Program, aiming to analyse real-life data from the New York Stock Exchange and create informative visual tools to communicate the results. The dataset, available on Kaggle, contains historical financial data from S&P 500 companies. A smaller subset of the data was created for this project. The primary objectives of the project are to demonstrate proficiency in calculating descriptive statistics, interpreting data, analysing and forecasting financial business metrics, and effectively communicating the results.
The project was divided into 3 tasks:
- Task 1: Conduct data analysis in a spreadsheet, including the computation of summary statistics, and formulate a question to be answered based on the analysis. Create a presentation to share the findings. You may choose to focus the data analysis on a sub-category or a specific company.
- Task 2: Develop Profit and Loss Statement Dashboard.
- Task 3: Create a Financial Forecasting Model using three forecasting scenarios.
Task 1: Summary Statistics and Presentation
After performing a comprehensive data analysis, the airline sub-category was chosen for examination. The identified question was:
The dataset included American Airlines (AAL), ALK Airlines (ALK), Delta Air Lines (DAL), Southwest Airlines (LUV), and United Airlines (UAL).
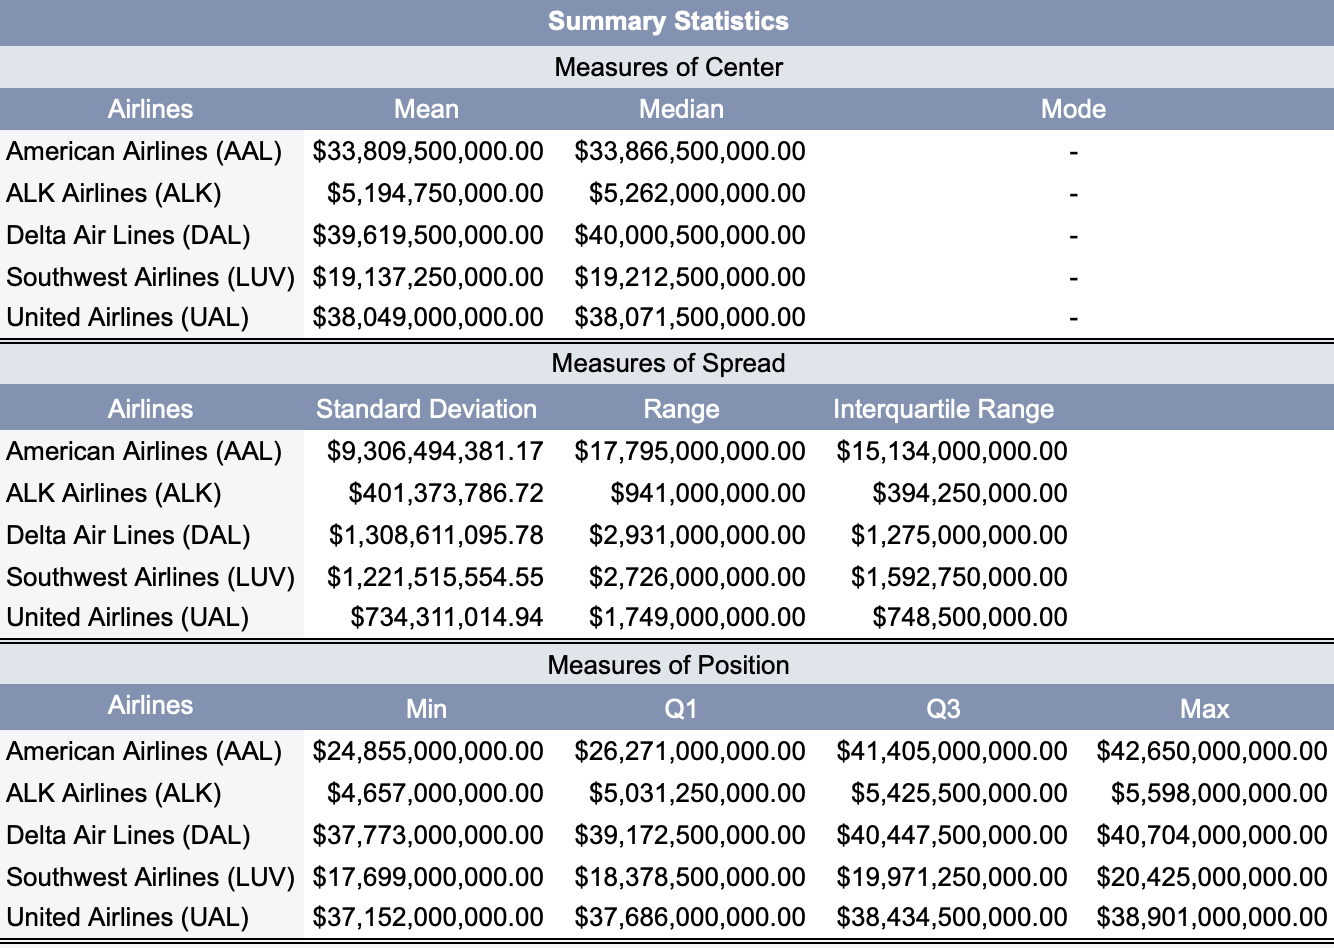
To answer the question, summary statistics of each airline was calculated.
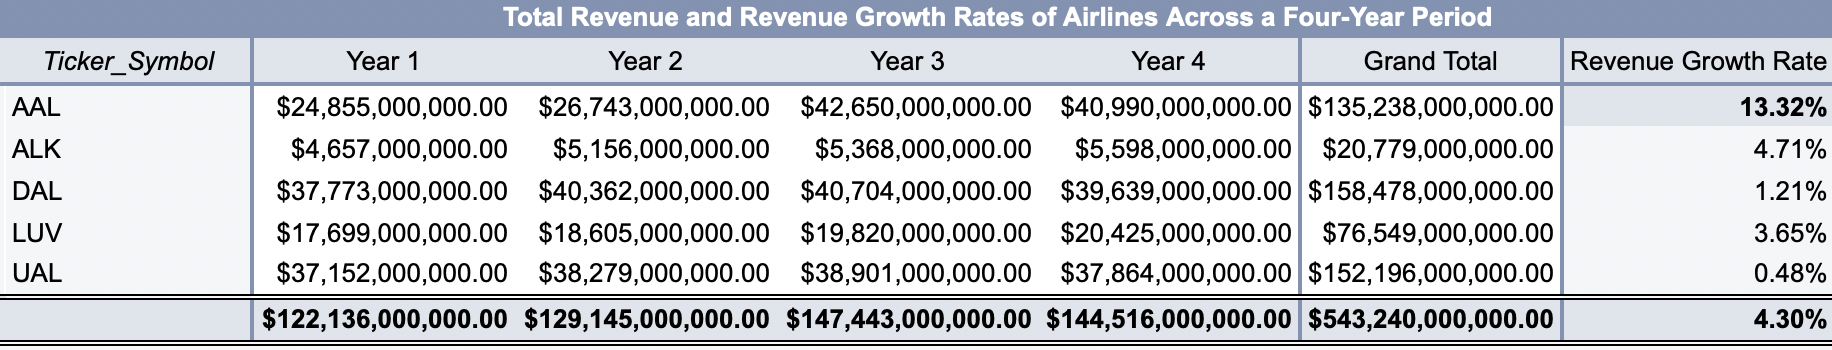
Another table was generated where total revenue and revenue growth rates for each airline across the four-year period were computed.
After thoroughly analysing all the data and the summary statistics, three graphs were created to share some insights:
1. The Average Total Revenue of Each Airline Across the Four-Year Period
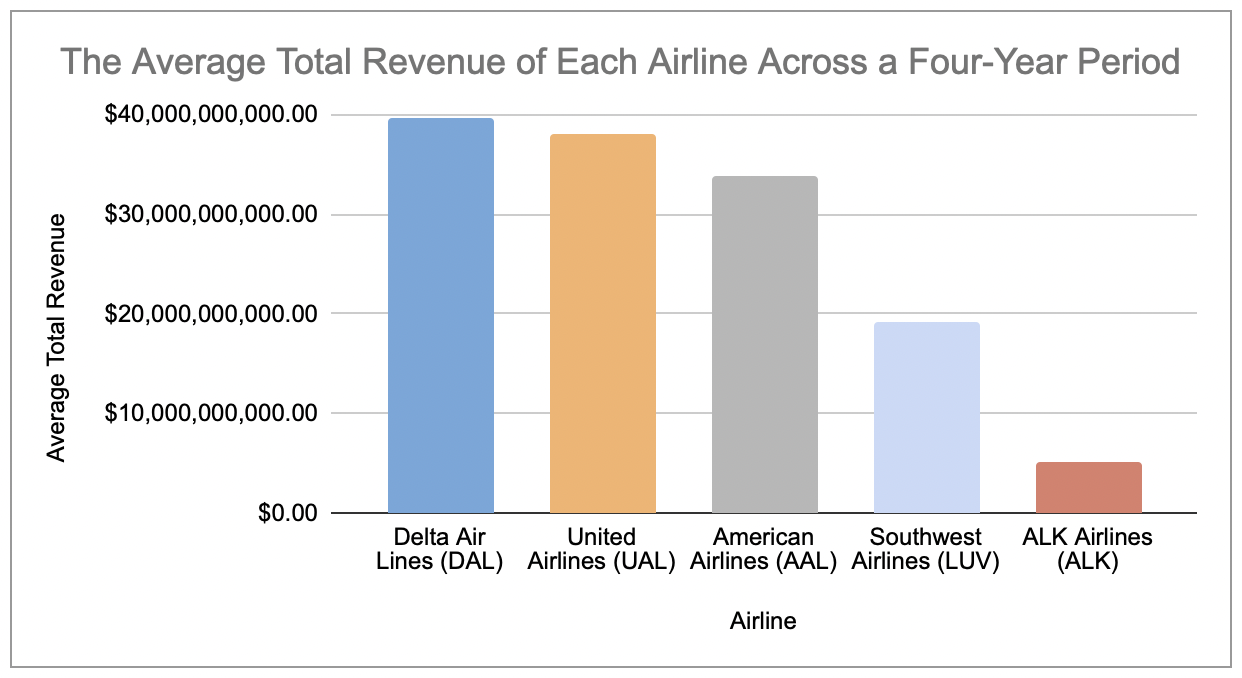
Insight
Delta Air Lines (DAL), United Airlines (UAL), and American Airlines (AAL) have the highest average total revenue over the four-year period, each averaging between $33 to $40 billion dollars.
2. Spread of Data of Each Airline Across the Four-Year Period
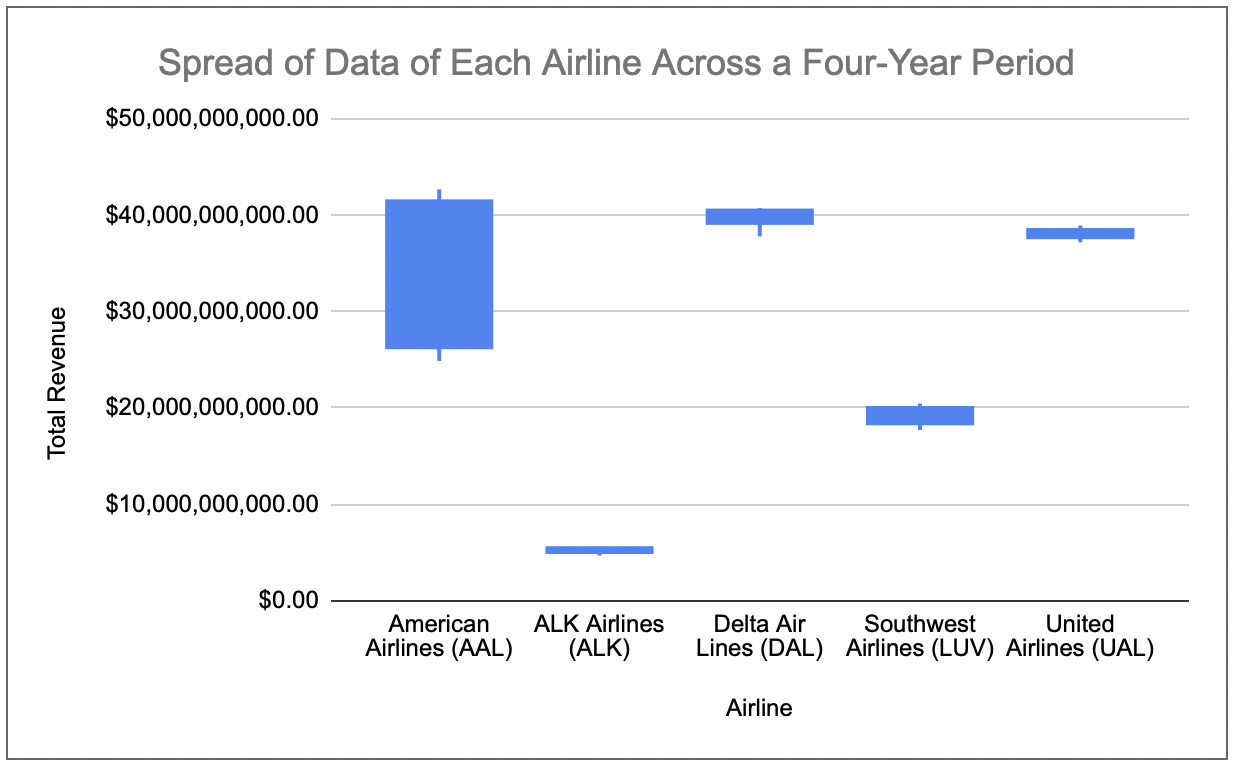
Insight
While American Airlines (AAL) ranks among the top 3 airlines in terms of total revenue, its standard deviation is notably high at $9,306,494,381.17. This indicates that its total revenue is widely dispersed and spread out from the mean. Moreover, its range is also substantial at $17,795,000,000.00, suggesting a wide range of values in the American Airlines dataset over the period.
In contrast, the other airlines have relatively narrow ranges, indicating that their total revenues are more stable throughout the period.
3. Revenue Growth Among Airlines Across the Four-Year Period
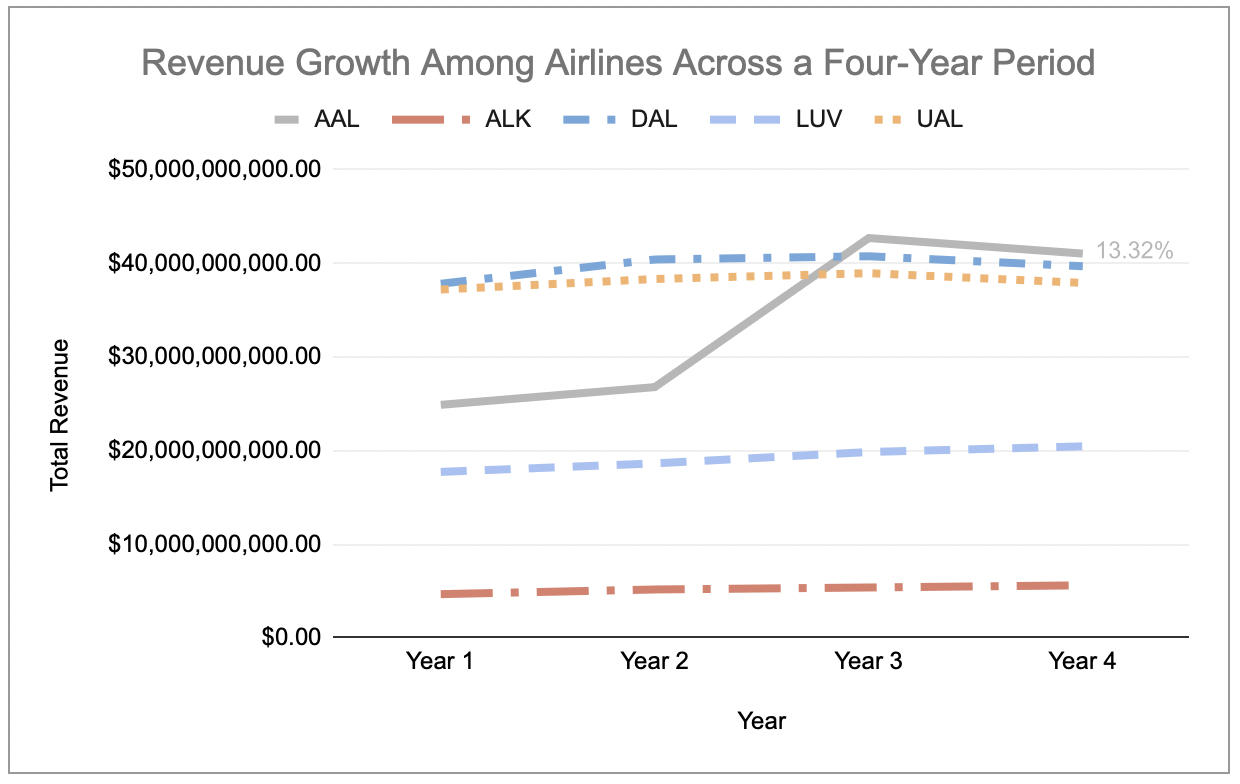
Insight
The variability in revenue for American Airlines is explained by the graph above, which shows that American Airlines (AAL) started with relatively moderate total revenue around $26 billion in the first two years before experiencing a drastic revenue growth in year 3, where its total revenue surged to $42,650,000,000.00.
This was further supported by the calculated revenue growth rate of 13.32% for American Airlines, which was the highest among all other airlines, which only had revenue growth rates around 0 to 5%.
This exponential revenue growth rate can be attributed to the merger between American Airlines and US Airlines at the end of 2013 (end of Year 2), forming one of the largest airlines in the world (Rushe, 2013).
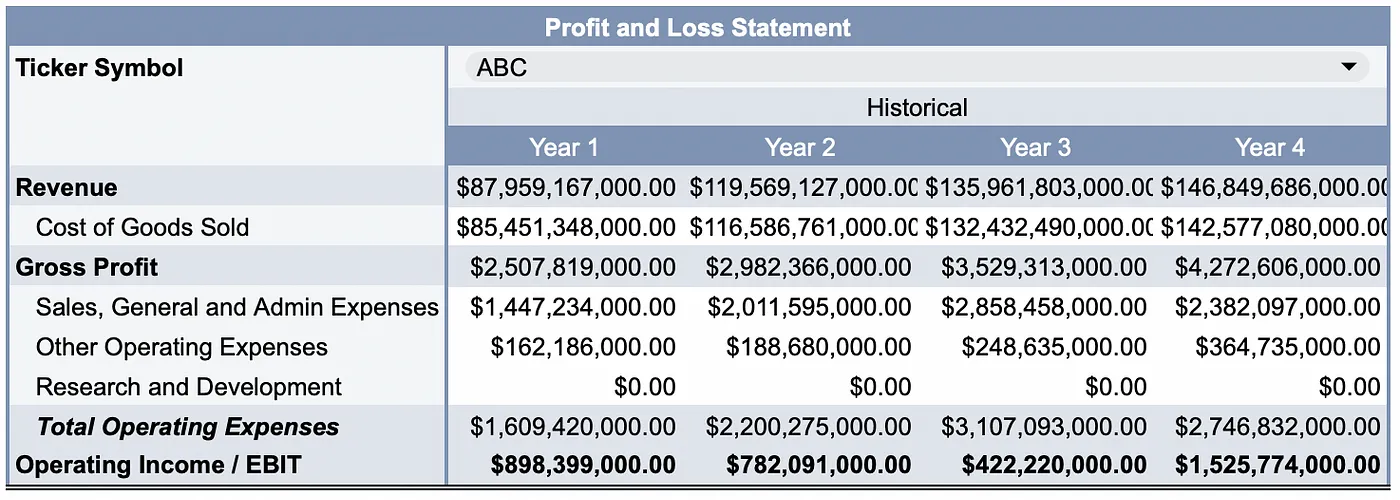
Task 2: Profit and Loss (P&L) Statement
In this section, a dynamic dashboard for a Profit and Loss (P&L) Statement was developed, featuring a drop-down list for ticker symbol selection, including all companies from the dataset.
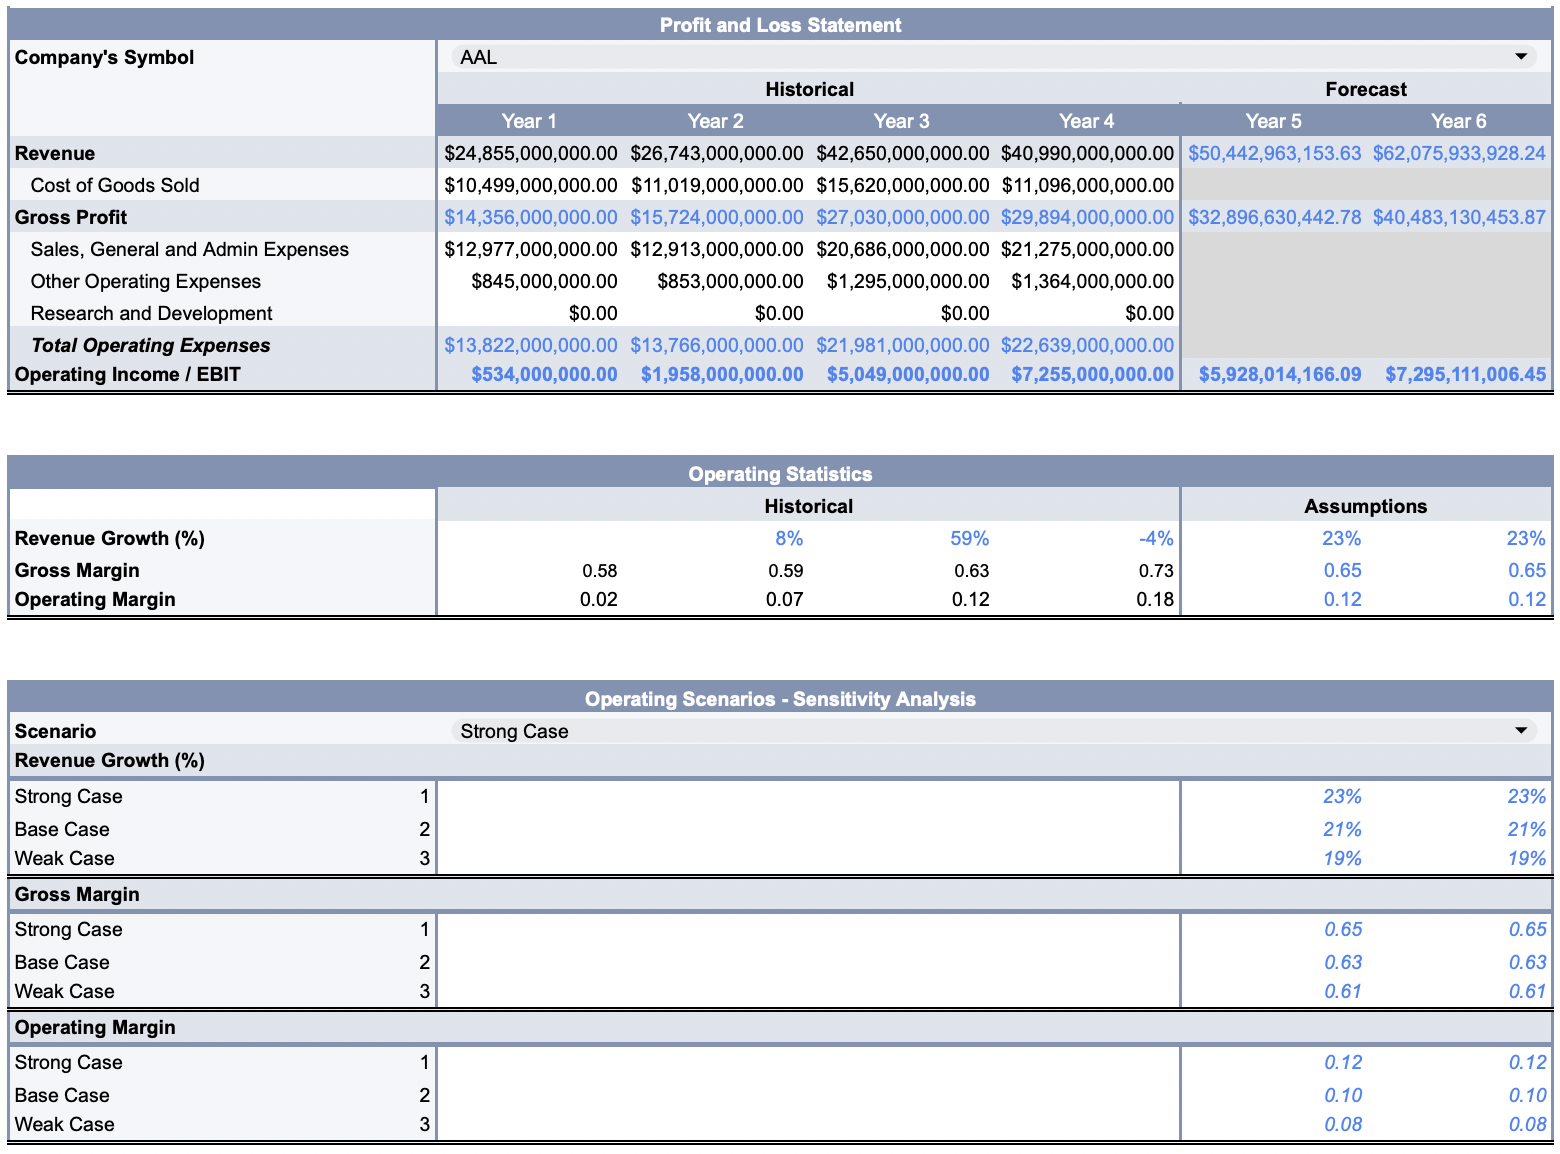
Task 3: Financial Forecasting Model
Lastly, a dynamic financial forecasting model was built to forecast Gross Profit and Operating Income for the next two years based on three forecasting scenarios: Strong Case, Base Case, and Weak Case. Once again, the focus was on airline companies, with a drop-down list allowing users to choose an airline and analyse its financial forecasts.
For access to the complete version of the Google Sheets File and presentation, please click on the provided links or visit my GitHub profile.